Innovation in Europe by “Regions”
These recommendations have many points of coincidence with the detailed analysis of the indicators and the establishment of root causes, which we already published in previous years and qualify as barriers to innovation in Spain.
RIS 2019
The Regional Innovation Scoreboard (RIS) is a regional extension of the EIS, European Innovation Scoreboard, which assesses the performance of innovation in the EU regions.
It is done with a limited number of indicators. The RIS 2019 covers 238 regions in 23 EU countries, Norway, Serbia and Switzerland. In addition, Cyprus, Estonia, Latvia, Luxembourg and Malta are included at the country level.
It is a comparative evaluation of regional innovation based on the EIS, using 18 of the 27 indicators of the latter.
A trend in innovation is grouping into territories and clusters.
The new scoreboard confirms that the most innovative regions in Europe are in the most innovative countries. The most innovative region in the EU is Helsinki-Uusimaa, Finland, followed by Stockholm, Sweden and Hovedstaden, Denmark.
Extending the EU framework, the most innovative region is Zϋrich in Switzerland. There are also some innovative regional centres in countries “moderate innovators”: Prague in the Czech Republic, Crete in Greece and Friuli-Venezia Giulia in Italy.
Regional groups based on the results
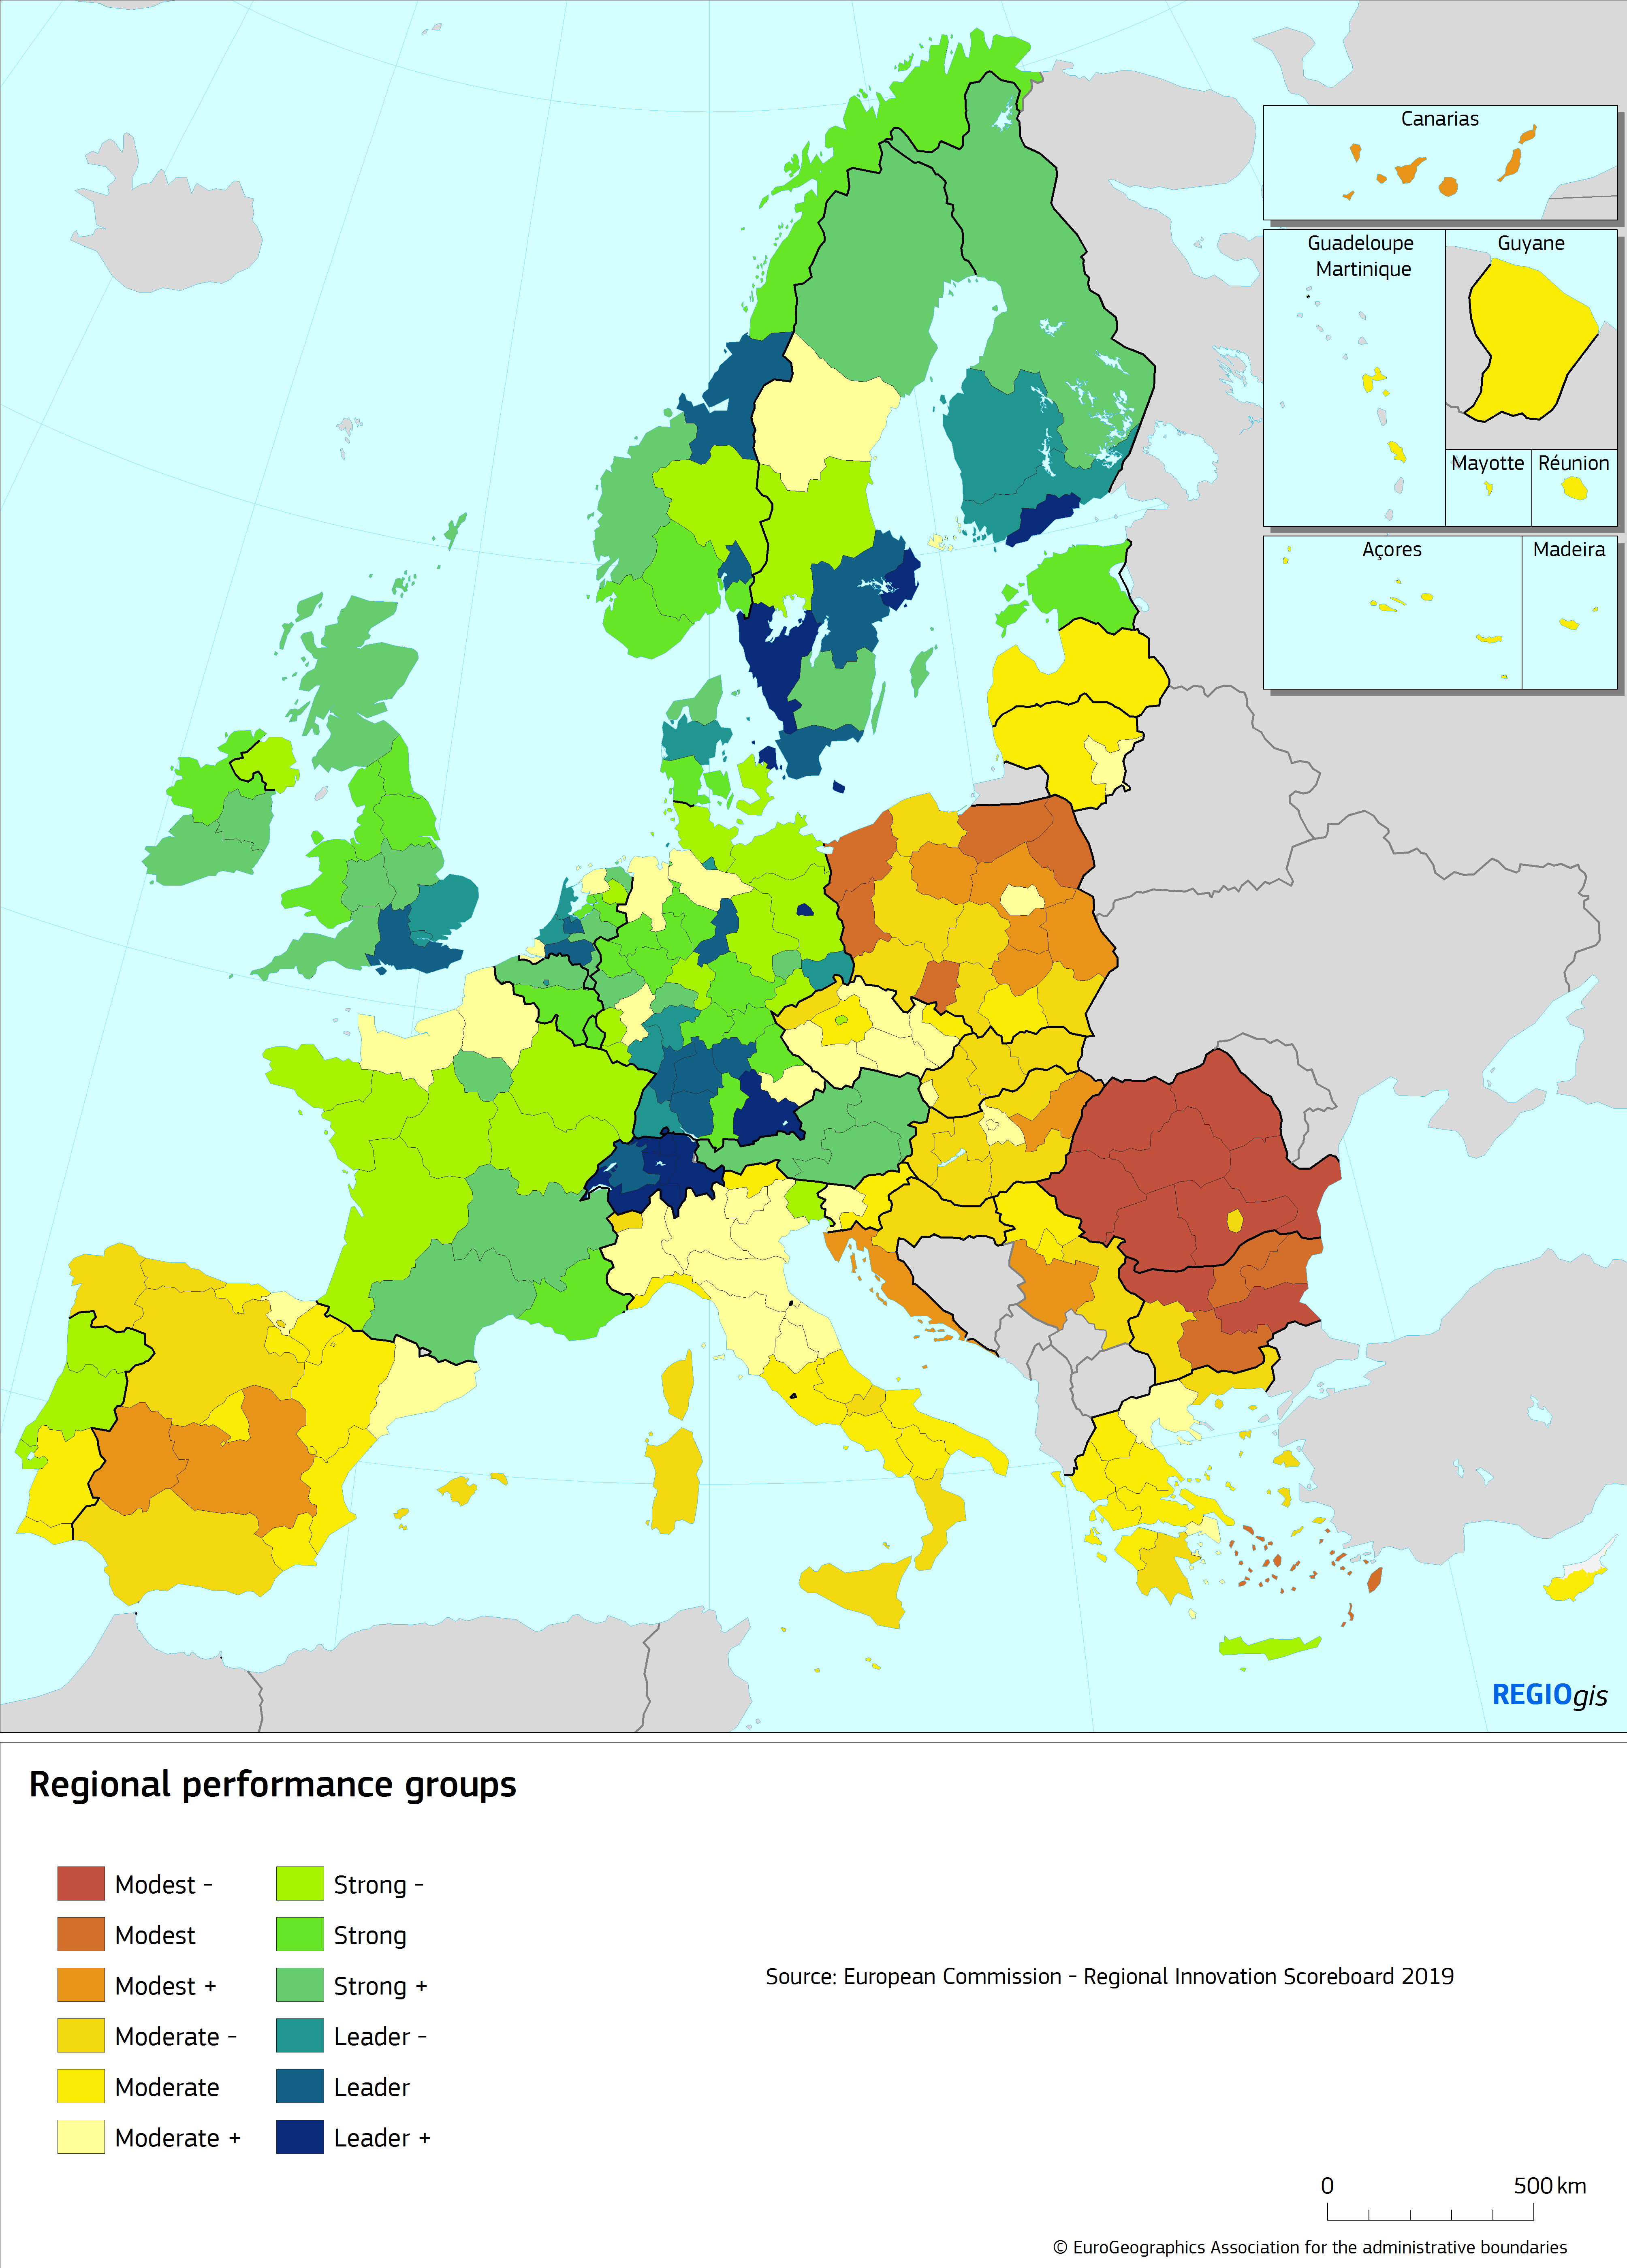 Following the example of the European scoreboard,
which classifies countries into four groups according to their innovation results, the regions of Europe are classified into:
- Innovation Leaders. The group includes 38 regions whose index exceeds 20% of the EU average.
- Strong innovators. It includes 73 regions with an index between 90 and 120% of the EU average
- Moderate innovators. With 98 regions that are between 50 and 90% of the EU average.
- Modest innovators. Group of 29 regions with an index below 50% of the average.
In total, 238 European regions are analysed, including some from countries outside the EU.
For greater detail, the groups are divided into 3 subgroups each, with the result of 12. Example: Leaders +, leaders, and leaders -, for the first group and so on. See map.
Analysis of results
The analysis of all this information exceeds this summary, but we present 3 aspects that, in my opinion, are relevant:
1. The most innovative regions, on average, work better in most of the indicators, as shown in the radar chart below, and also tend to be in the most innovative countries
Average scores for each group in relation to the EU average (= 100). Scores calculated excluding countries for which there are no regions (Cyprus, Estonia, Latvia, Luxembourg and Malta).
Regions rated as moderate and modest innovators obtain values below the EU in general, except in innovation expenses not related to R&D, which reflects the fact that these countries innovate buying machinery, advanced equipment and knowledge, developed in other places, rather than investing in their own R&D activities.
All regional innovation leaders belong to countries identified as innovation leaders or strong innovators in the EIS 2019 and belong to 10 countries.
All ‘Regional Modest Innovators’ belong to the ‘Moderate or Modest Innovators’ countries. However, there are some areas of excellence in some moderate innovative countries:
- Prague (Prague) in the Czech Republic,
- Kriti (Crete) in Greece
- Friuli-Venice, Giulia in Italy.
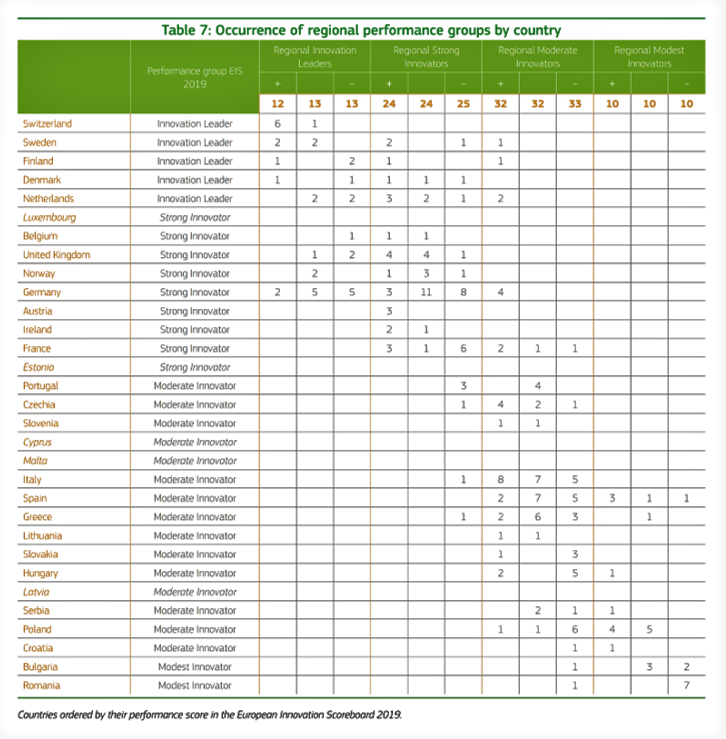
The following table shows the regional dispersion by groups within each country, ordered according to the EIS 2019 indices.
Ranking of regions
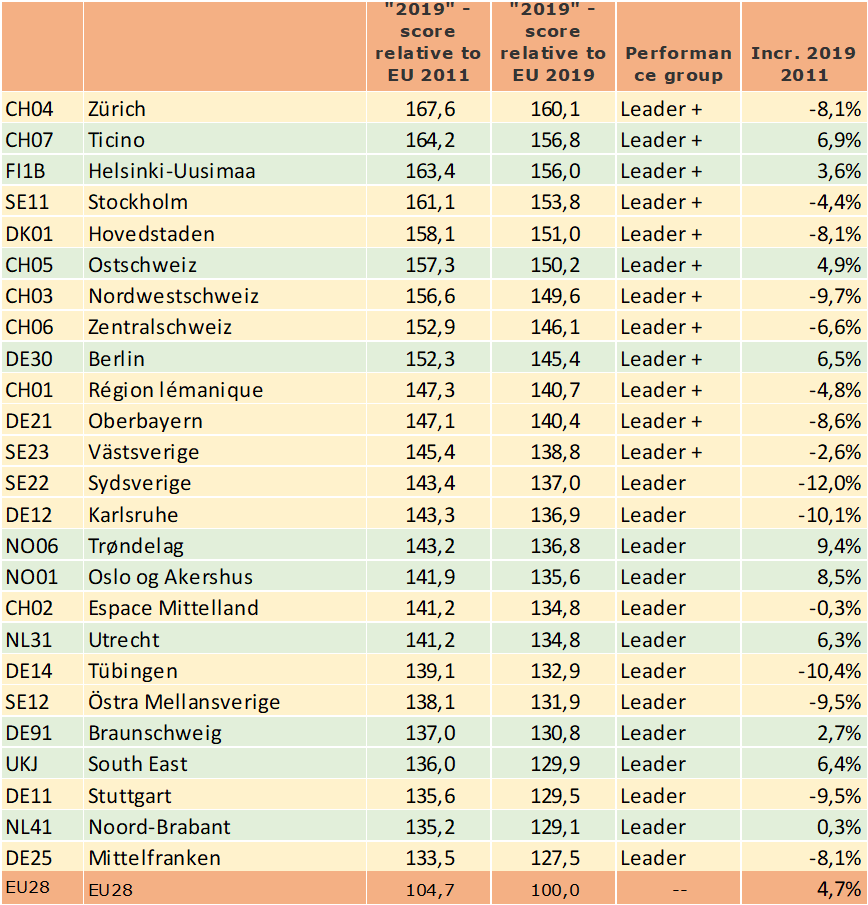
(SE11) in Sweden and Hovedstaden (DK01) in
Denmark. In the following table we see the first 25 European
regions in innovation, their innovation index and the state in which they belong.
The most innovative region in the EU is Helsinki- Uusimaa (FI1B) in Finland, followed by Stockholm
The most innovative region in total Europe in 2019 is Zurich (CH04).
Of the top 10 regions, five are in Switzerland and five in the EU.
Growth from 2011 to 2019
The following map shows the performance changes over time using colour codes. The innovation
index has increased in all green regions, with darker shades of green showing higher degrees of increase.
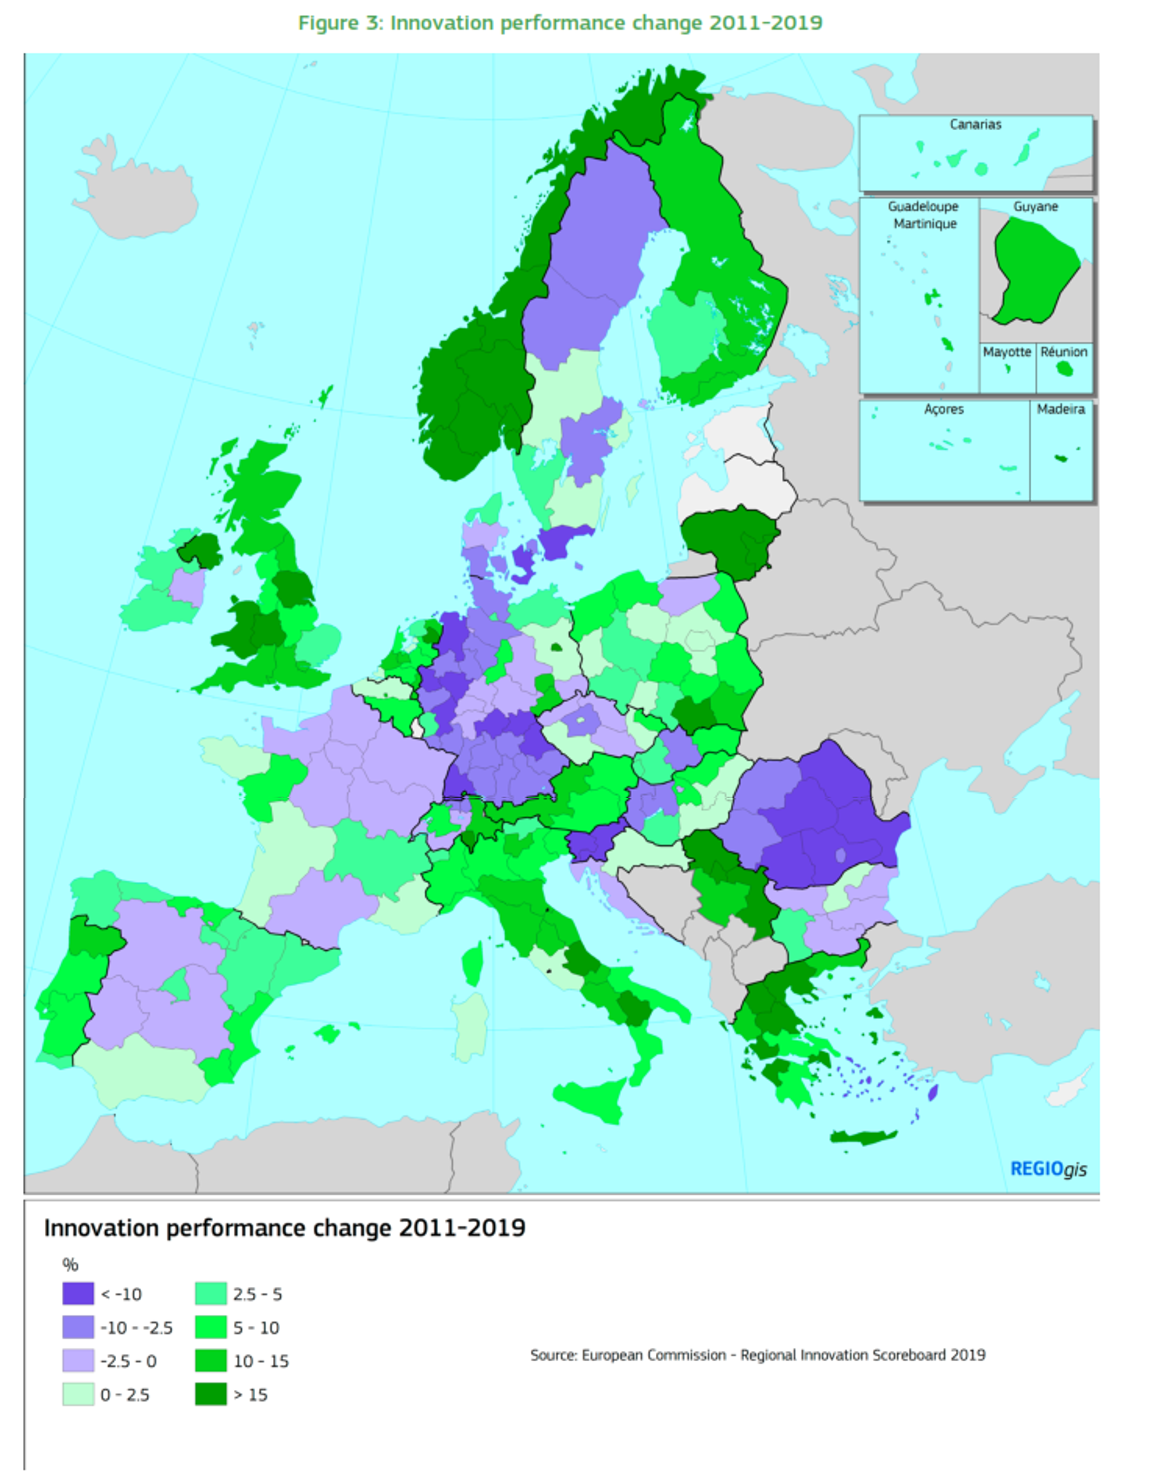
Innovation index has declined in all purple regions, with darker shades of purple showing higher levels of decline.
Index increased very strongly by more than 15% in 31 regions and has increased strongly between 5% and 10% for other 31 regions.
In 29 regions, performance has declined between -10% and -5%, and for 18 regions, performance has declined strongly by more than 10%.
Differences in the innovation index within the states. Case of Spain:
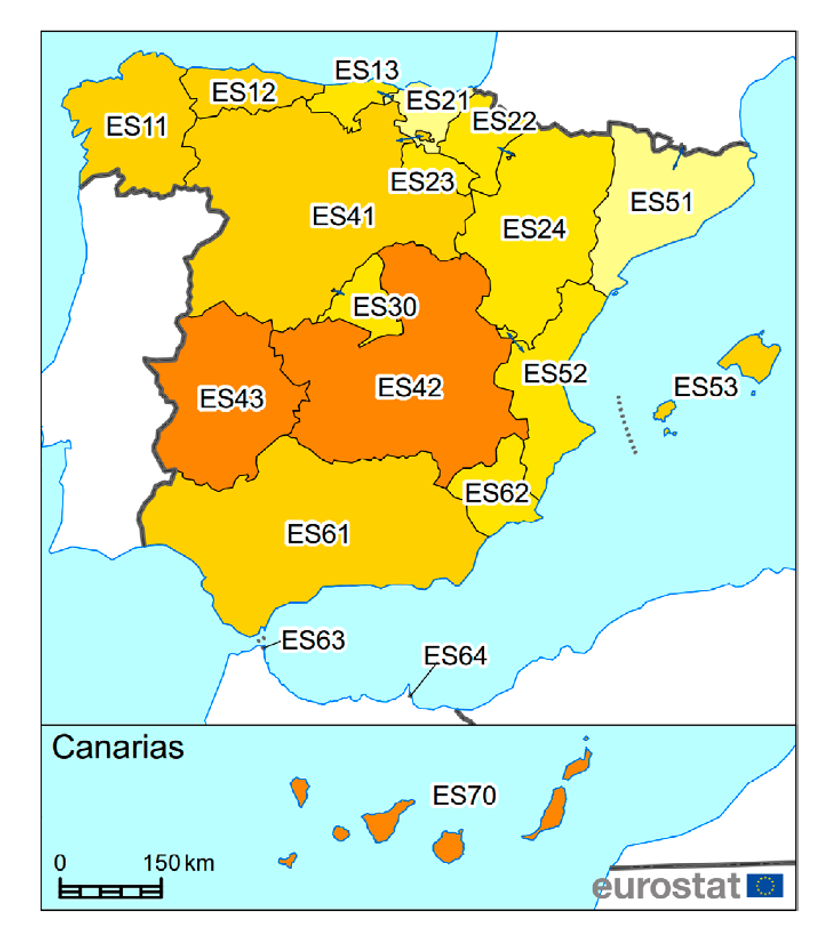
Spain is a “moderate innovator” and includes
19 european regions, which coincide with the autonomous communities. (We have included 17,
without considering the cities of Ceuta and Melilla, due to their small size and special cases).
There are strong differences in the innovation index between the different communities.
Even so, it should be noted that the first innovation community, the Basque Country, appears in the European ranking at position 132 of the 238 regions.
The Spanish region with the lowest index, Extremadura, appears in position 218 of the 238.
The Basque Country (ES21), is the community with the highest innovation rate, almost double (x1.84) to the lowest community, Extremadura (ES43).
In addition, the Basque Country shows an 11.8% growth in the index compared to 2011, while Extremadura decreases 3.1%, so the differences increase.
Most of the Spanish communities are in the group of “moderate innovators” like Spain in total, but two of them (Basque Country and Catalonia) rank in the “Moderate +” segment.
Five communities fall into the “Moderate – ” segment, Asturias, Galicia, Balearic Islands, Castilla-León and Andalusia.
Three communities are in the lowest group, “Modest Innovators +”: Canarias, Castilla-La
Mancha and Extremadura.
Author & Copyright: Francesc Güell
Agile Innovation
© Francesc Güell 2020 – published by DMi with the kind permission of Francesc

